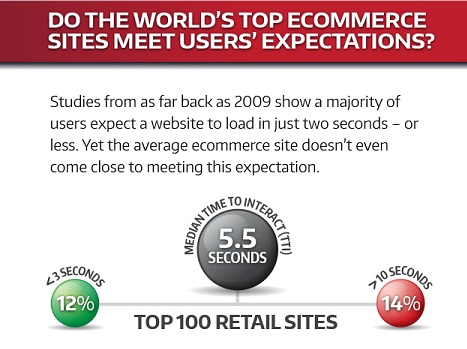
As the 2015 holiday shopping season rapidly approaches, only a few retailers – 12% of the top 100 ecommerce sites – are currently meeting customer expectations for both content and page speed, according to Radware's latest web performance report,
According to Statista, retail sales are estimated to exceed $1.7 trillion in 2015. Radware’s findings are a warning to the retail industry: bulky, slow web pages will fail to convert sales – even when top retailer’s sites may meet consumer demand for more content and complexity.
In fact, 57% of site visitors will abandon a web page after just three seconds if they are unable to interact with the key content. This Time to Interact (TTI) is critical.
“Site performance and download times are some of the most critical aspects of ecommerce that correlate to conversion rates,” said Sucharita Mulpuru, Forrester Research.
No retailer wants to abandon up to 57% of their inbound site traffic, especially during the holiday selling season. Retailers must invest in user experience for online customers, and that includes both content and page load time. Serving more content to customers is expected but the goal is delivering more content, faster. That’s the "magic formula". Web performance optimization, or lack thereof, will directly impact the bottom line for retailers this holiday season.
Today’s consumers expect more feature-rich browsing and shopping experiences that rely heavily on the increased use of high-pixel-count imagery, GIF and animated file formats, JavaScript, and app-like animations. Radware found that because of this, site owners are adding more features but they are not taking advantage of core optimization techniques. These issues result in increasing page sizes and complexity that typically contribute to slower load times.
Additional findings from the report include:
■ Page size and complexity are common contributors to slower load times, impacting the TTI. The median page is 1945 KB in size and contains 169 resource requests. The median Time to Interact is 5.5 seconds, which is considerably slower than users’ reported wait-time threshold of 3 seconds. The slowest page on the top 100 list had a TTI of 34.1 seconds.
■ Site owners have not implemented the latest core optimization techniques. Despite the fact that images comprise 50% to 60% of the average page’s total size, 48% of the top 100 sites received an “F” score from webpagetest.org for image compression.
The report also includes 14 tips to take your website from slow to "go" this holiday season, including:
■ Preload resources in the browser using an automated solution to increase load speed
■ Reformat images – avoid wasting bandwidth with unnecessarily high resolution
■ Rethink the design and location of call to action links below large feature banners
■ House heavy content below the fold to allow a faster loading experience
■ Consolidate JavaScript and CSS into common files
■ Compress text using common technologies like gzip
Kent Alstad is VP of Acceleration at Radware.

Methodology: The tests in this study were conducted using an online tool called WebPagetest – an open-source project primarily developed and supported by Google – which simulates page load times from a real user’s perspective using real browsers. Radware tested the home page of the top 100 sites from the Alexa Retail 500 three consecutive times. The system automatically clears the cache between tests. The median test result for each home page was recorded and used in our calculations. The tests were conducted on July 16, 2015, via the WebPagetest.org server in Dulles, VA, using Chrome 43 on a DSL connection. In very few cases, WebPagetest rendered a blank page or an error in which none of the page rendered. These tests were re-run with the same criteria, and flagged as such, with the results substituted in the list. To identify the Time to Interact (TTI) for each page, Radware generated a timed filmstrip view of the median page load for each site in the Alexa Retail 100. Time to Interact is defined as the moment that the featured page content and primary call-to-action button or menu is rendered in the frame.
The Latest
While most companies are now deploying cloud-based technologies, the 2024 Secure Cloud Networking Field Report from Aviatrix found that there is a silent struggle to maximize value from those investments. Many of the challenges organizations have faced over the past several years have evolved, but continue today ...
In our latest research, Cisco's The App Attention Index 2023: Beware the Application Generation, 62% of consumers report their expectations for digital experiences are far higher than they were two years ago, and 64% state they are less forgiving of poor digital services than they were just 12 months ago ...
In MEAN TIME TO INSIGHT Episode 5, Shamus McGillicuddy, VP of Research, Network Infrastructure and Operations, at EMA discusses the network source of truth ...

A vast majority (89%) of organizations have rapidly expanded their technology in the past few years and three quarters (76%) say it's brought with it increased "chaos" that they have to manage, according to Situation Report 2024: Managing Technology Chaos from Software AG ...
In 2024 the number one challenge facing IT teams is a lack of skilled workers, and many are turning to automation as an answer, according to IT Trends: 2024 Industry Report ...
Organizations are continuing to embrace multicloud environments and cloud-native architectures to enable rapid transformation and deliver secure innovation. However, despite the speed, scale, and agility enabled by these modern cloud ecosystems, organizations are struggling to manage the explosion of data they create, according to The state of observability 2024: Overcoming complexity through AI-driven analytics and automation strategies, a report from Dynatrace ...
Organizations recognize the value of observability, but only 10% of them are actually practicing full observability of their applications and infrastructure. This is among the key findings from the recently completed Logz.io 2024 Observability Pulse Survey and Report ...
Businesses must adopt a comprehensive Internet Performance Monitoring (IPM) strategy, says Enterprise Management Associates (EMA), a leading IT analyst research firm. This strategy is crucial to bridge the significant observability gap within today's complex IT infrastructures. The recommendation is particularly timely, given that 99% of enterprises are expanding their use of the Internet as a primary connectivity conduit while facing challenges due to the inefficiency of multiple, disjointed monitoring tools, according to Modern Enterprises Must Boost Observability with Internet Performance Monitoring, a new report from EMA and Catchpoint ...
Choosing the right approach is critical with cloud monitoring in hybrid environments. Otherwise, you may drive up costs with features you don’t need and risk diminishing the visibility of your on-premises IT ...
Consumers ranked the marketing strategies and missteps that most significantly impact brand trust, which 73% say is their biggest motivator to share first-party data, according to The Rules of the Marketing Game, a 2023 report from Pantheon ...


