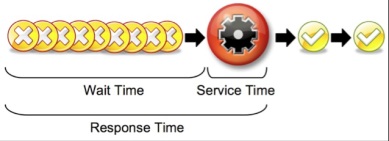
Response time is the total amount of time you waited for something you asked for. If you have response time data, there are some really interesting questions you can answer about the total amount of time spent waiting and theoretical max throughput that can be achieved.
Here we will look at a couple of them:
Utilization
Utilization is the technical term for “busy” and is typically expressed as a decimal fraction with a range between zero and one. A 45% busy resource has a utilization of 0.45. Nothing can be more than 100% busy. No matter how much your boss wants it to be so, there is no 110% to give.
As utilization goes up, the response time also tends to go up – keep reading to find out why. Only a fool would plan for a service center to be 100% busy, as there is no margin for error and the incoming work never arrives at the expected rate.
Service Time
A service center is where the work gets done. CPUs, processes, and disks are examples of service centers.
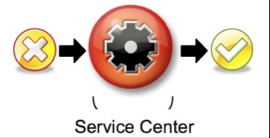
To accomplish a given task, it is generally assumed that it takes a service center a fixed amount of time – the service time. In reality this assumption is usually false, but still very useful. The crafty people who designed your hardware and software typically put a few optimizations in the design.
If you could meter every job going through a service center you’d find that the amount of time and effort to accomplish each “identical” job is somewhat variable. Having said this, it is still a useful abstraction to think about each identical task taking an identical amount of time to be serviced at the service center. Just as you don’t require quantum mechanics to predict the flight path of a baseball, you can mostly ignore the individual variations and focus on the big picture.
Averaged over time, a service center can have a utilization from zero to one or, if you prefer, 0% to 100% busy.
You are always interested in the utilization averaged over a short period of time, i.e., seconds or minutes. You are never interested in the instantaneous utilization (it is always 0 or 1) and are rarely interested in the utilization averaged over long periods (hours, days, etc.) like a month because that long an average can hide serious shenanigans and suffering.
You can set the boundaries of a service center anywhere you like. A service center can be a simple process, or the entire computer, or an entire array of computers. For that matter a service center can be an oven. The service time for baking bread = 30 minutes at 350°F. A service center is where work gets done, and you get to define the boundaries.
Arrivals and Throughput
Work arrives at a service center and, when processing is complete, it exits. The work is composed of discrete things to do that might be called transactions, jobs, packets, tasks, or IOs, depending on the context.

The rate at which tasks arrive at the service center is the arrival rate. The rate at which tasks exit a service center is called the throughput. In performance work, most of the time these values are measured over a period of a second or a minute and occasionally over a longer period of up to an hour.
To stay out of trouble, be sure that you don’t confuse these terms and keep your units of time straight. Arrivals are not the same as throughput, as anyone knows whose ever been stuck in a long airport security line. If you accidentally mix “per second” and “per minute” values in some calculation, then badness will ensue. Try not to do that.
Wait Time
Unless you are reading this in a post-apocalyptic world where you are the only survivor, there will be times when tasks arrive at a faster rate than the service center can process them. Any task that arrives while the service center is busy has to wait before it can be serviced. The busier the service center is, the higher the likelihood that new jobs will have to wait.
The upper limit on wait time is controlled by two things: the maximum number of simultaneous arrivals and the service time. If ten tasks arrive simultaneously at an idle service center where the service time is 10 milliseconds, then the first task gets in with zero wait time, the last job will wait for 90 milliseconds. The average wait time for all these tasks is:
45ms = (0+10+20+30+40+50+60+70+80+90) / 10
The overall (or average) response time is what most people care about. It is the average amount of time it takes for a job (a.k.a. request, transaction, etc.) to wait for service plus the service time itself. If the user is geographically separated from the service center then you have to add in transmission time, but we’ll save that for a different post.
Finding Service Time
As you’ll see shortly, the wait and the service time are wildly useful numbers to know, but the response time is the only number that most meters, if they provide that data at all, are likely to give you. So how do you dig out the wait and the service time if there are no meters for them?
The service time can be determined by metering the response time under a very light load when there are plenty of resources available. Specifically, when:
- Transactions are coming in slowly with no overlap
- There have been a few minutes of warm-up transactions
- The machines are almost idle
Under these conditions, the response time will equal the service time, as the wait time is approximately zero.
ServiceTime + WaitTime = ResponseTime
ServiceTime + 0 = ResponseTime
ServiceTime = ResponseTime
Finding Wait Time
The wait time can be calculated under any load by simply subtracting the average service time from the average response time. This is a useful calculation to do as it shows you how much better things could be if all the wait time was cleared up. Performance work, at some level, is all about time and money. If you know the wait time, you can show how much time a customer might save if your company spent the money to fix the performance problem(s) you’ve discovered.
Finding the Maximum Throughput
If you know the service time, you can find the maximum throughput because:
MaxThroughput ≤ 1 / AverageServiceTime
A service center with an average service time of 0.05 seconds has a maximum throughput of: 1 / 0.05 = 20 per second.
CAUTION: With this calculation you have to be a bit careful when you have a broadly defined service center. For example, a Google search I did for the word “cat” returned after 0.25 seconds. This value was reasonably constant when tested very early in the morning on a holiday weekend so we can assume that the utilization of the Google servers is fairly low. Using the above formula, we can scientifically show that the maximum throughput for Google is four searches per second. Clearly that is not right. So, is this rule wrong? No, it was just used in the wrong place. Google has a massively parallel architecture, and so we are not looking at just one service center. Here we got a reasonable Average Service Time, did the calculation, and came up with a Max Throughput number that made no sense. With all these tools the most important things you bring to the party are common sense and a skeptical eye.
Bob Wescott is the author of “The Every Computer Performance Book”.
Related Links:
The Every Computer Performance Blog

