AWS is a cloud-based computing platform known for its reliability, scalability, and flexibility. However, as helpful as its comprehensive infrastructure is, disparate elements and numerous siloed components make it difficult for admins to visualize the cloud performance in detail. It requires meticulous monitoring techniques and deep visibility to understand cloud performance and analyze operational efficiency in detail to ensure seamless cloud operations.
Here are the crucial metrics you need to keep track of while monitoring your AWS cloud environments to ensure high efficiency and uninterrupted cloud services.
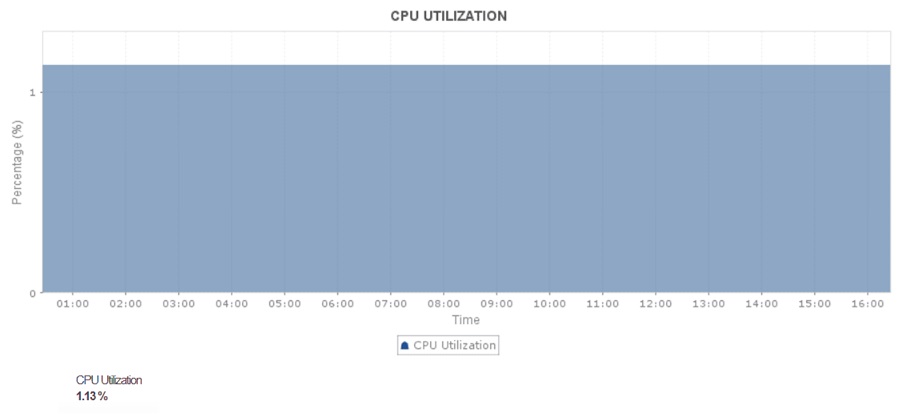
1. CPU usage
The cloud doesn't just make your applications and resources accessible; it makes them organized so teams can manage and coordinate efficiently while catering to an extensive workload. When any service or IT component is actively in use, it consumes CPU resources. This is because the CPU is responsible for executing the instructions and calculations that drive the service's functionality. The cloud is no exception, especially for AWS Compute resources that run your workloads (EC2 or ECS).
Monitoring and understanding CPU utilization trends help you determine whether the instances are over- or under-utilizing the CPU.
By tracking CPU usage, you can pinpoint applications and code algorithms that are consuming a major part of your resources, and balance the workload accordingly to optimize CPU utilization. If it is not optimized at the component-level, it could lead to starvation among the components, apart from those that are over-consuming the CPU. To avoid severe issues like application lag and crashes due to CPU starvation, set up alarms for different levels of threshold breaches and act in time to optimize CPU usage.
2. Memory
Memory plays a key role in keeping a cloud environment intact. It supports cloud stability by storing data for fast access, preventing slowdowns, and avoiding crashes under high loads. With insufficient memory, it would be difficult to scale up cloud services, maintain productivity, and ensure smooth cloud operations, especially among dynamic cloud environments.
Monitoring memory utilization and allocation helps admins identify inefficient resource allocation that can lead to cloud performance issues, downtime, or unnecessary cloud costs. You can't compromise on this KPI, as it helps you identify and rectify issues in scaling and allocation.
Especially in the AWS cloud, it is important to be precise while scaling. In instances like ECS and EKS, allocating the right amount of memory to the tasks and processes that cater to larger workloads keeps them from running out of resources, ensuring seamless cloud operation. It also partially eliminates the scope for issues like memory leaks. On the contrary, it's equally important to ensure the smaller workloads and other resources are assigned adequate memory and to downsize the resources that are not in use.
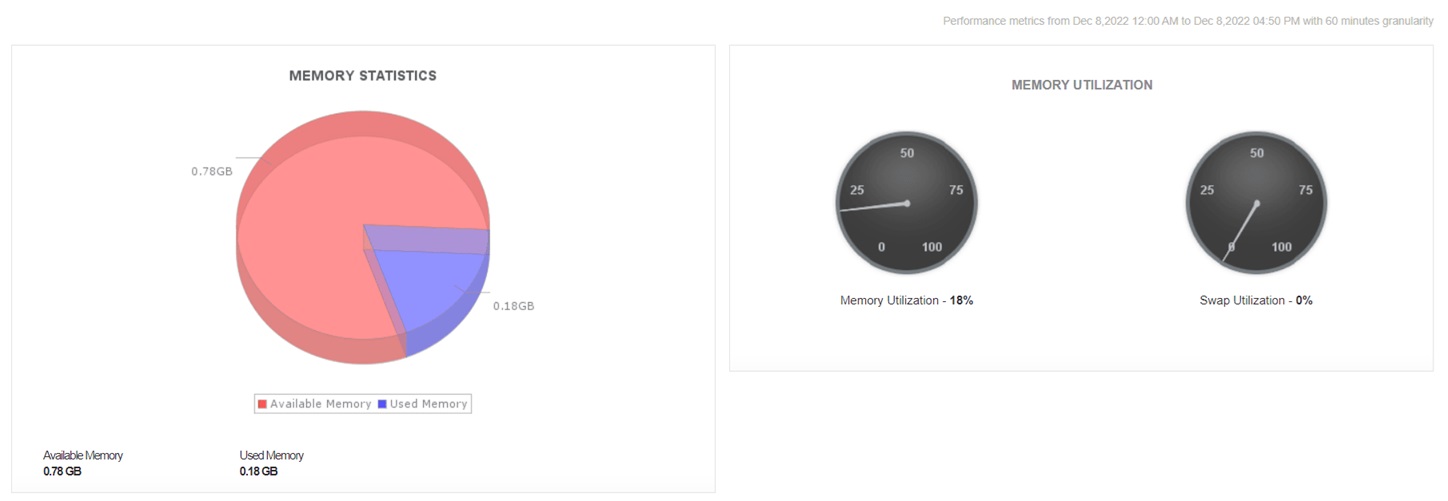
Knowing the right amount of memory required by the tasks no longer remains a challenge when you are keeping track of memory usage by each instance down to the last container, database, pod, and nod in real time. Trend analysis helps you understand the nature of your workloads and helps you predict future requirements.
3. Disk throughput
Disk I/O shows the amount of data being read from and fed to your AWS cloud in a given time interval. Tracking the volume of this data in bytes helps you easily understand data traffic and identify potential bottlenecks before they lead to notorious incidents like downtime or worse, crashes.
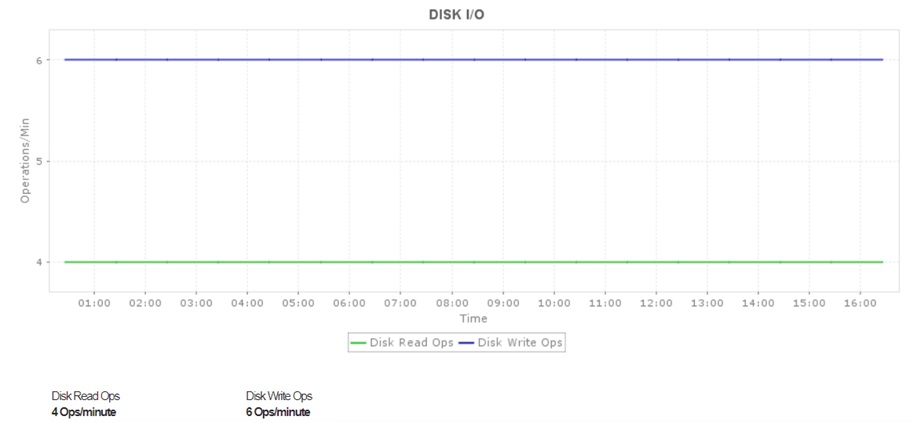
How does simply identifying bottlenecks help?
It doesn't. But once you spot a potential bottleneck, you can reduce the load on the specific instance by configuring a caching mechanism, which can take the load of long queues and performance anomalies off your back.
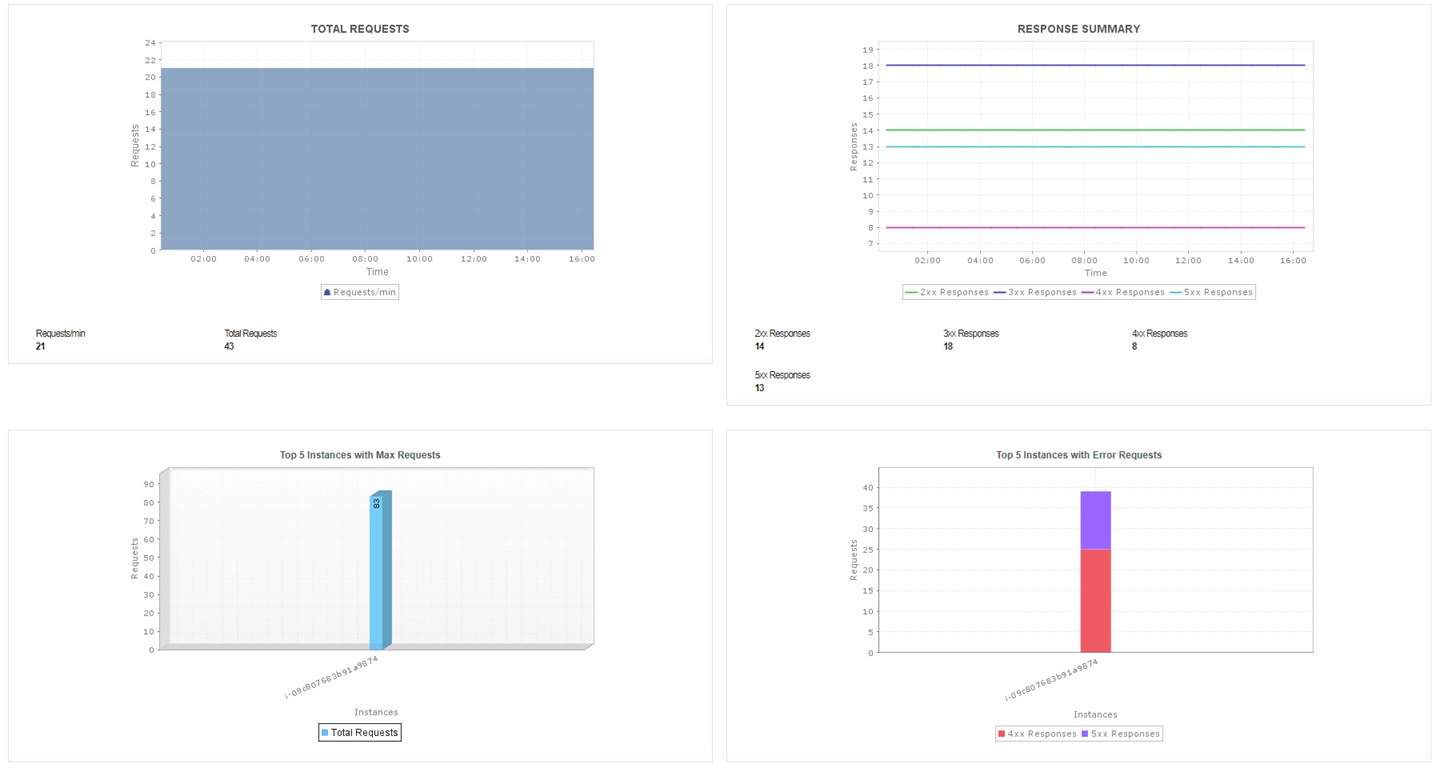
4. Requests
The request count metric sheds light on the total number of requests raised per instance in your AWS ecosystem.
Monitoring AWS cloud to keep a track of request rates helps you identify spiking request traffic and troubleshoot respective instances for potential misconfiguration or DNS-related issues. Visibility into requests helps admins visualize the frequency and nature of incoming and outgoing service transactions. This allows them to understand resource requirements, identify performance anomalies, and prevent potential outages and service interruptions. Setting up adaptive threshold profiles keeps you informed about peaking request traffic and eliminates false alarms, especially when serving numerous workloads ranging from web applications to big data analytics.
5. Latency
is the interval of time taken by an application to respond to a user request. High latency indicates poor AWS cloud performance. It is usually observed in AWS cloud environments with poor network connections, misconfigured host servers, or improper dependencies among web servers.
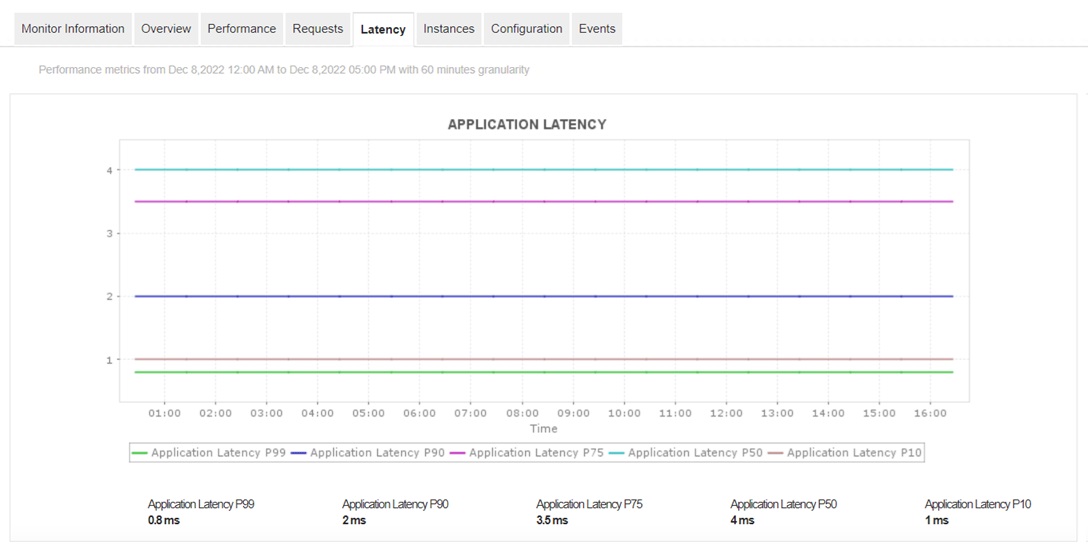
Monitoring latency in AWS allows admins to identify issues like network congestion, misconfigurations, slow transactions, and weakly performing components efficiently. Without proper visualization of latency in AWS, many performance issues like high response times, delayed transactions, and many more could go unnoticed and have a major negative impact on the cloud experience. Monitoring server latency in real time helps identify slow components, enabling quicker issue fixes and smoother cloud operations.
Why choose a unified monitoring solution?
Monitoring your AWS environment from AWS CloudWatch and other native monitoring tools might be handy at first. Once you start monitoring large-scale environments across multiple regions, CloudWatch can become cumbersome. Limitations include:
- Limited detail for in-depth analysis.
- Basic alerting features without advanced anomaly detection or integration options (eg: Slack).
This is why it's essential to find a monitoring tool that can accommodate your disparate IT environment and provide deep visibility into your IT infrastructure.
ManageEngine Applications Manager offers monitoring support for over 150 technologies, including cloud native and on premise components. It can accommodate numerous cloud providers, i.e., AWS, Azure, GCP, Oracle, and OpenStack. You can get extensive performance analytics, such as code-level diagnostics and user experience monitoring, which are beyond the scope of CloudWatch. You also get superior visualization capabilities in the form of more intuitive dashboards that help teams quickly identify performance issues.