Observability has become a critical component of managing modern, complex systems, helping organizations ensure uptime, optimize performance, and quickly diagnose issues. However, the way most vendors address observability today has left companies frustrated. Skyrocketing costs, rigid vendor lock-in, and needless complexity have turned what should be an empowering capability into a significant pain point. But the tide is shifting. With open-source projects stepping in to fill key parts of the observability stack, the market is on the brink of a major disruption. Much like other industries that have embraced modular, open architectures, observability is entering a new era of flexibility, cost efficiency, and innovation.
The First Wave of Observability
Microservices and distributed architectures improve scalability but add complexity, making issue detection harder. Enter Observability by analyzing metrics, logs, and traces to provide real-time insights, detect issues, and ensure uptime.
While analyzing data was not new, the first wave of observability vendors had a breakthrough innovation: the ability to instrument applications and collect health data from complex systems. By making metrics, logs, and traces accessible for analysis, these vendors enabled companies to monitor their infrastructure like never before. This was a game-changer for IT operations, setting the stage for modern observability as we know it.
The Challenges and Pain Companies Face Today
While the original observability platforms were innovative, they've since created significant pain points for businesses. Over time, these monolithic solutions have locked customers in and inflated costs.
- Unsustainable Costs: Observability costs are often tied to the volume of data collected. As businesses grow, so do their observability bills — increasingly to unsustainable levels. Industry luminaries Jeremy Burton and Charity Majors have both tagged Observability costs to often reach 30% of IT infrastructure spend.
- Vendor Lock-In: Vendors force customers into all-or-nothing bundles — agents, visualization tool, query engine, storage, data movement tool, etc. Over time, this dependency grows, making it increasingly difficult and costly to switch to better solutions.
- Fragmented Visibility: These platforms store metrics, logs, and traces in separate, proprietary systems, creating inefficiencies when performing root cause analysis.
The result is a market rife with frustration, as companies struggle to manage the costs and complexity of monolithic observability stacks. In cases where existing solutions are expensive and fail to meet expectations, innovators step in to create better, more cost-effective alternatives. As Jeff Bezos famously said, "Your margin is my opportunity," highlighting how expensive products that leave needs unmet invite disruption by new entrants.
From Monolithic to Disaggregated: A New Era of Observability
The observability market is undergoing a seismic shift, moving from monolithic platforms to a disaggregated stack. To understand what that means by way of analogy, consider what happened to data warehouses.
The original data warehouse vendors — Teradata, IBM, and Oracle — sold tightly integrated "appliances" bundling database software, servers, storage, networking, and operating systems, locking customers into inflexible, proprietary ecosystems that were costly to maintain. Today, organizations have shifted to modular, cloud-based data warehouses. Companies now choose what database software they want and configure cloud infrastructure, which offers flexibility to optimize cost, performance, and scalability while avoiding vendor lock-in.
The catalyst for the change in the data warehouse market was the cloud. The catalyst for this transformation in observability is OpenTelemetry (OTel), an open-source standard that has removed the proprietary barriers to collecting and transmitting observability data. By standardizing how metrics, logs, and traces are instrumented and exported, OTel has eliminated one of the key enablers of vendor lock-in. But OTel just addresses one layer of a full solution.
In the disaggregated observability stack, companies now select best-of-breed solutions for each layer. Companies can use whatever software they want to move observability data, store it, query it, or visualize it.
In many cases there are clear open source winners that have emerged:
- Agents: OTel is becoming the de facto standard for instrumentation.
- Collection: Kafka handles data ingestion and transport.
- Visualization: Grafana leads the way in open-source dashboards for visualizing observability data.
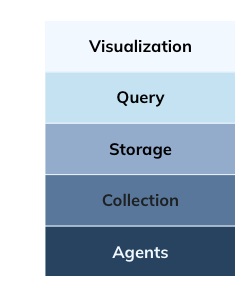
The query and storage layer in the disaggregated observability stack is a critical battleground for open-source projects. Open-source query engines like Prometheus and ClickHouse have become key players in the observability ecosystem, but they still face limitations in creating a unified, cost effective alternative. Prometheus excels at querying real-time metrics but lacks support for logs or traces, and its pull-based architecture struggles with scale, requiring complex federation and sharding.
Similarly, ClickHouse has gained traction for log-based queries but falls short for metrics and time-series data, leaving observability gaps. Additionally, its compute inefficiencies for real-time workloads can drive up costs as data volumes increase, highlighting the need for more affordable, unified observability solutions.
More and more companies are turning to Apache Pinot to fill this role. Originally developed at LinkedIn, Pinot was designed as a real-time, columnar analytics database capable of handling massive scale with subsecond query speeds. Recently, Pinot has evolved to meet the demands of modern observability use cases:
- Time-Series Analytics: New contributions to the open-source project by Uber have optimized Pinot for time-series workloads, making it ideal for metrics, logs, and traces.
- PromQL Support: Pinot now integrates with Prometheus Query Language (PromQL), enabling seamless visualization in tools like Grafana.
- Unified Observability: Unlike legacy vendors that store data in separate silos, Pinot allows companies to unify metrics, logs, and traces in a single platform.
This shift isn't just about performance — it's about cost. Apache Pinot's efficient architecture and tiered storage help organizations scale observability affordably.
Open source is disrupting observability by offering:
- Freedom: Open source tools like Pinot, Grafana, Kafka, and OTel prevent vendor lock-in.
- Cost Efficiency: Open-source economics and cloud storage cut costs.
- Innovation: Community-driven development drives rapid evolution.
As observability costs grow, open source offers a smarter, more affordable path forward.