Adopting an Application Performance Management (APM) strategy will help you manage the quality of the customer experience. The challenge is that APM has evolved into a mosaic of monitoring tools, analytic engines, and event processors that provide many solutions to different problem sets.
When you step back and look at the big picture it all comes into focus, but when you’re trying to rationalize one technology over another, things aren't so clear at close range. Product overlaps, ongoing costs, and ownership come into question, and then someone will eventually inquire about the benefits they are receiving from these tools sets.
You will be tempted to demonstrate all the bells and whistles the products provide in hoping to convince them that the value outweighs the complexity. Don't overlook the profound impact a childlike view can have with understanding application performance. “Sometimes the questions are complicated and the answers are simple.” - Theodor Seuss Geisel (aka. Dr. Seuss)
It is important to show how an APM solution can tie into existing systems, by articulating the big picture, so that IT leaders can conceptualize the value coming from the new solution. How you articulate the Manager of Managers (MoM) concept and how it will support the APM strategy is essential for buy-in.
As you begin, start by identifying the dual purpose toolsets (i.e. provisioning and monitoring) already in the organization to incorporate as part of the APM solution. Then consider choosing a technology that is “application aware” to spear-head your real-user-monitoring (RUM) initiative. When done correctly, Application Aware Network Performance Monitoring (AANPM) can become the linkage between silos, providing relevant performance data in a context that all groups will understand, and subsequently trust. For more on this read, APM & MoM - Symbiotic Solution Sets.
I have found that the simplicity and ease of use with agent-less monitoring (i.e. wire data analytics) is a great place to start. It should have the capability to provide insight for the protocols specific to your critical applications (e.g. XML, SQL, PHP, etc.).
Since agentless monitoring is “always on” it will be ready to monitor any new applications launched into production within its purview. There’s no need to worry about managing a fully burdened application life cycle for a typical agent installation, although when the time comes agent monitoring is recommended to fully instrument an application.
For example, when expanding a critical business application across our northern locations we used agentless monitoring to present a dashboard that answered specific performance questions about availability and user response times. It was a basic graph with two data elements across one dimension of time, making it easy to compare the current end-user-experience (EUE) to its normal baseline. A somewhat elementary but very effective way to communicate the real-time performance back to the developers and IT leadership at the same time during the rollout. See Figure 1.
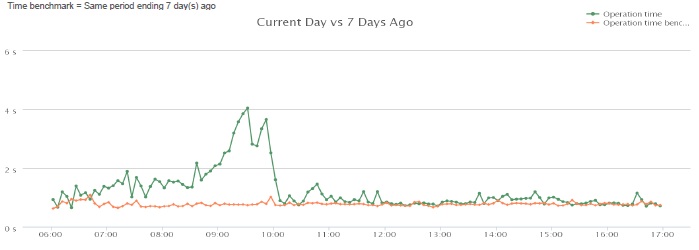
As the application usage increased with user load, we noticed that performance rose well above the normal baseline. We observed an increase in application operation time, which had a direct correlation to page aborts, indicating user frustration. Then the system reached the point of critical mass and started presenting HTTP 500 errors. Based on a simple performance breakdown showing server time over its threshold and network time within baseline, the developers were directly engaged and the network team was on standby. See Figure 2.
Click on Figure 2 below for a larger image
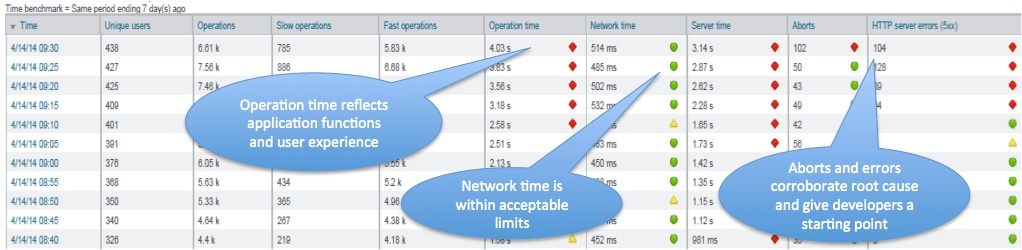
Given this starting point, the development team began troubleshooting the performance discrepancy early on and before mid-day they had identified the root cause and added a new Index to one of the very large data sets that was being called frequently.
Conclusion
As you strive to achieve new levels of sophistication when creating performance dashboards, don’t overlook the simplicity of highlighting just a few metrics on one page that mean something to the support team. This will take an understanding of the application and knowledge of how the metrics are being collected to be succinct. Be patient, just as water seeks its own level, an application performance baseline will eventually emerge as you track the real-time performance metrics outlining the high and low watermarks of the application.
For further insight, Click here for the full article.
You can contact Larry on LinkedIn.
The Latest
The use of hybrid multicloud models is forecasted to double over the next one to three years as IT decision makers are facing new pressures to modernize IT infrastructures because of drivers like AI, security, and sustainability, according to the Enterprise Cloud Index (ECI) report from Nutanix ...
Over the last 20 years Digital Employee Experience has become a necessity for companies committed to digital transformation and improving IT experiences. In fact, by 2025, more than 50% of IT organizations will use digital employee experience to prioritize and measure digital initiative success ...
While most companies are now deploying cloud-based technologies, the 2024 Secure Cloud Networking Field Report from Aviatrix found that there is a silent struggle to maximize value from those investments. Many of the challenges organizations have faced over the past several years have evolved, but continue today ...
In our latest research, Cisco's The App Attention Index 2023: Beware the Application Generation, 62% of consumers report their expectations for digital experiences are far higher than they were two years ago, and 64% state they are less forgiving of poor digital services than they were just 12 months ago ...
In MEAN TIME TO INSIGHT Episode 5, Shamus McGillicuddy, VP of Research, Network Infrastructure and Operations, at EMA discusses the network source of truth ...
A vast majority (89%) of organizations have rapidly expanded their technology in the past few years and three quarters (76%) say it's brought with it increased "chaos" that they have to manage, according to Situation Report 2024: Managing Technology Chaos from Software AG ...
In 2024 the number one challenge facing IT teams is a lack of skilled workers, and many are turning to automation as an answer, according to IT Trends: 2024 Industry Report ...
Organizations are continuing to embrace multicloud environments and cloud-native architectures to enable rapid transformation and deliver secure innovation. However, despite the speed, scale, and agility enabled by these modern cloud ecosystems, organizations are struggling to manage the explosion of data they create, according to The state of observability 2024: Overcoming complexity through AI-driven analytics and automation strategies, a report from Dynatrace ...
Organizations recognize the value of observability, but only 10% of them are actually practicing full observability of their applications and infrastructure. This is among the key findings from the recently completed Logz.io 2024 Observability Pulse Survey and Report ...
Businesses must adopt a comprehensive Internet Performance Monitoring (IPM) strategy, says Enterprise Management Associates (EMA), a leading IT analyst research firm. This strategy is crucial to bridge the significant observability gap within today's complex IT infrastructures. The recommendation is particularly timely, given that 99% of enterprises are expanding their use of the Internet as a primary connectivity conduit while facing challenges due to the inefficiency of multiple, disjointed monitoring tools, according to Modern Enterprises Must Boost Observability with Internet Performance Monitoring, a new report from EMA and Catchpoint ...


